Short answer: Total sales shows how many homes changed hands. Turnover rate shows how that activity compares with the number of homes in the area. You need both, because either one alone can mislead you. Price fit, housing type and days on market still matter too.
Reviewed by Tom Shearer, Broker/Owner
Updated: October 2026 · Last verified: October 14, 2026
When you’re weighing up real estate farming in Edmonton, comparing two farm areas by total sales feels like the obvious move. It can also point you at the wrong neighbourhood.
In my last post I asked where the homes your ideal client wants already exist. I left one question hanging: is there enough turnover to justify showing up there consistently?
This post answers it.
Total sales doesn’t tell the whole story
Total sales tells you how many homes changed hands in a neighbourhood over a set period. That’s a real number, and it matters. It just doesn’t tell you how big the neighbourhood behind it is.
A neighbourhood with 1,000 homes may record more sales than one with 200 simply because there are more homes that could change hands. Size alone can make a total look impressive.
What turnover rate measures
Turnover rate puts sales next to the size of the housing stock.
Turnover rate = relevant sales ÷ relevant housing stock × 100
One detail matters here. The sales and the housing counts need to match by property type and geographic area, and the housing count needs to be appropriate for the period you’re measuring. If you’re measuring turnover for detached homes, divide by the detached housing stock, not every residential unit in the neighbourhood. Divide detached sales by all units and you still get a number. It just isn’t the number you think you have.
The denominator changes the story.
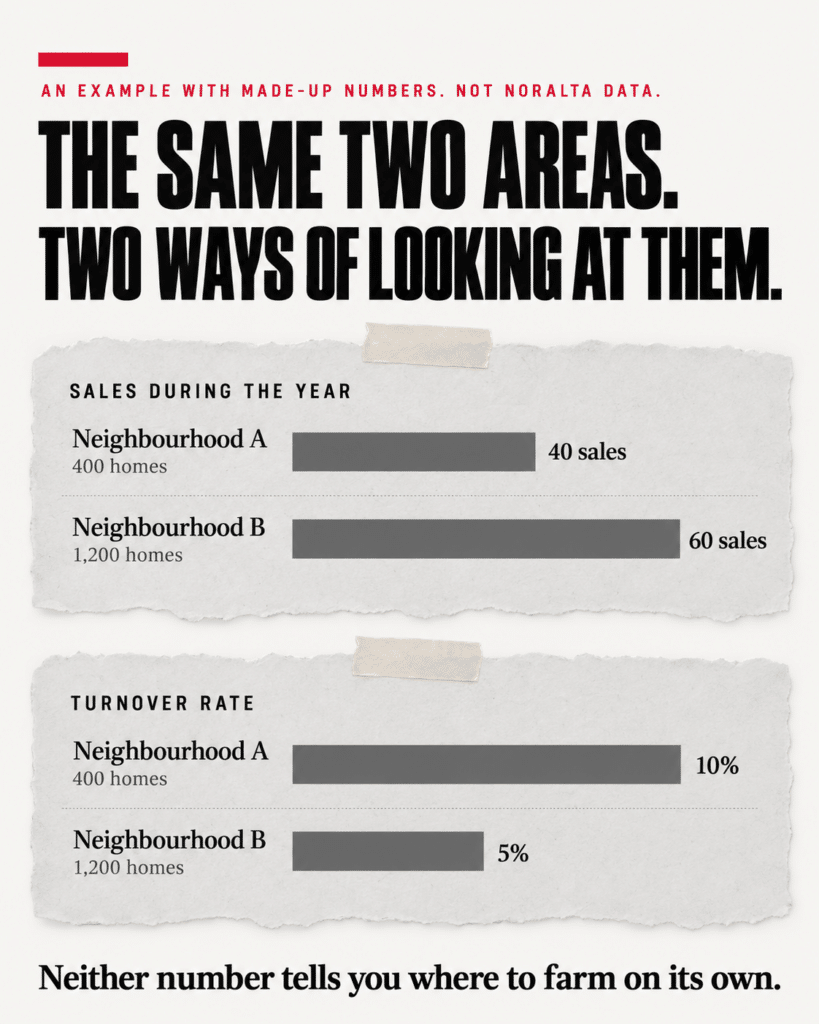
Here’s a made-up example with round numbers. It isn’t Noralta data, and it doesn’t describe any real neighbourhood.
| Neighbourhood A | Neighbourhood B | |
|---|---|---|
| Relevant homes | 400 | 1,200 |
| Sales during the year | 40 | 60 |
| Turnover rate | 10% | 5% |
Neighbourhood B recorded more sales, 60 against 40. But Neighbourhood A had twice the turnover rate. A was busier relative to its size. B still had more transactions overall.
That’s why I want to see both numbers. One tells me how many sales happened. The other puts that activity next to the number of homes.
Neither tells me, on its own, which is the best neighbourhood to farm.
Why both numbers matter for farming
Farming is a long game. You’re building relationships and a steady presence in one area, not chasing a single transaction.
Turnover helps me see how often sales happen relative to the number of homes I’d be trying to reach. But I also need to know how many transactions are happening overall, whether those homes fit the clients I want to serve, and whether the area makes sense for the time and marketing budget I’m prepared to commit.
A higher turnover rate gives me a reason to look closer. It doesn’t make the decision.
Two cautions. In a small neighbourhood, a handful of sales shifts the rate a lot, so look at more than one period. And know which period you’re looking at: a rate built on one year isn’t the same as one built across three.
The housing count underneath the rate is a count of dwellings, not active listings. Treat the rate as a guide, not a precise measurement.
Turnover isn’t the only number
Each number fills in what the other misses, and neither one replaces the rest of the picture.
Price fit matters. Whether the housing matches the client you want to serve matters. Days on market matters too, because a fast market behaves differently from a slow one even at the same turnover.
Where NACA fits
NACA puts both numbers side by side. It sets about three years of Edmonton-area sales against housing counts by type, drawn from census and municipal data, and shows sales, sales per 1,000 homes and the share of stock sold for the period you choose. Pick one month and you get a one-month rate. Pick a year and you get a yearly rate.
We need to know what we’re counting, what we’re comparing it against and whether the comparison makes sense. The AI doesn’t do that math. The numbers are calculated first, and the AI helps explain them.
Like last time, what comes out is a short list to check against current market information in Paragon, not a verdict. The same logic applies in communities like Sherwood Park, Spruce Grove and Fort Saskatchewan.
Where to go from here
If you picked a farm area because it “had a lot of sales,” take a second look at what that number was measuring. Chasing the highest turnover rate misses the point. What matters is what each number says about the business you’re building.
Next in the series: the workflow from persona to the mailbox, then neighbourhood mail versus postal code targeting.
Frequently Asked Questions
What is turnover rate in real estate?
Turnover rate compares the sales in a period with the number of homes of the same type in the area. Divide the sales by the housing stock, then multiply by 100.
Why can turnover rate be more useful than total sales when comparing farm areas?
Total sales can favour larger neighbourhoods because they have more homes that could change hands. Turnover rate puts activity next to housing stock, so you can compare how active areas are relative to their size, provided the property types and areas match and the housing counts suit the period measured. It works best alongside total sales, not instead of it.
What is a good turnover rate?
There isn’t one number that works everywhere. Compare areas against each other, using the same property type and the same time period, and look at more than one period. A rate means most when it sits next to another rate.
Should turnover rate be the only factor in choosing a farm area?
No. Total sales, price fit, housing type and days on market all matter alongside it. Turnover adds context that total sales can’t. It doesn’t replace the rest of the analysis.
How does NACA calculate turnover rate?
NACA sets sales activity against housing counts by type from census and municipal data, then shows sales per 1,000 homes and the share of stock sold. The rate covers whatever time period is selected, so a one-month selection gives a one-month rate, not a yearly one. The calculation happens separately from the AI. Housing counts are dwellings, not active listings, so the rate is a guide, not an exact figure.